By Lucy Proctor
Looker Studio (formerly Google Data Studio) is a brilliant tool that helps you visualise your data with customisable dashboards and reports. We first added to our repertoire of tools back in 2016 when Google introduced it as part of the Google Analytics 360 suite, and it’s been a firm favourite ever since.
It’s one of our most useful day-to-day tools, not only for supporting our own accounts management, but also for our client reporting. So without further ado, here’s 7 reasons why you should dive into Data Studio if you’re running paid media ads.
7 reasons to love Looker Studio:
1. Custom visualisation
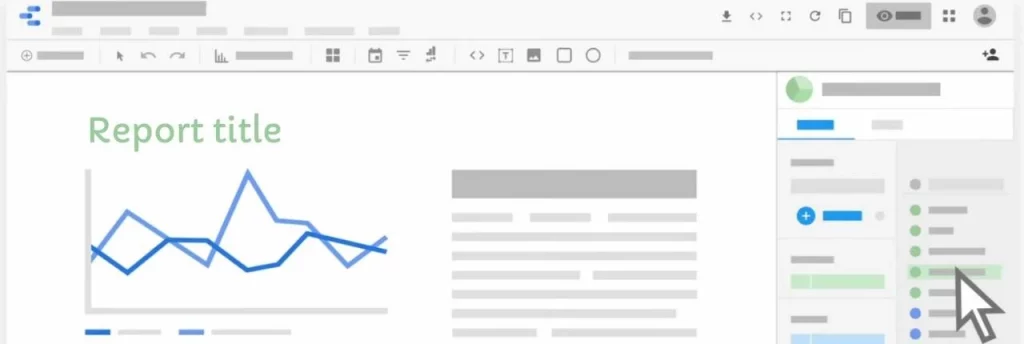
Spend a lot of time checking dull spreadsheets? It’s time for an upgrade! One of the key benefits of Looker Studio is that it’s a highly visual analysis tool, enabling your data to easily be displayed via different charts, graphs, and tables at the click of a button.
For each element, you can choose which trends to highlight, how much information to include (e.g. ad image previews or just ad names) and which parts to make interactive in order to have the most visual impact.
Looker Studio dashboards are fully customisable in every respect, meaning you can add company logos, colour schemes, and brand fonts to make your reporting a little more fun! If you’re a visual learner, the numbers are likely to make a lot more sense now too.
2. Combined data
Most of our ambitious advertisers run campaigns across many different platforms at any one time, with each one likely having its own associated budgets, benchmarks and targets.
Looker Studio has an incredible 500+ (and counting!) data source connectors so it’s the perfect place for all of your data from different places to be easily combined. You can pull in your latest engagement results from Facebook and Instagram, your average Google Analytics goal completion rate, and your company forecast spreadsheet to analyse your top-level performance at a glance throughout the month, or simply display everything you’ve got running alongside each other. Whatever you want!
3. Calculated fields
Looker Studio can be used for simple reporting tasks, but it also has powerful analysis capabilities. This is where calculated fields come in: you can manipulate the data to directly suit your needs.
Calculated fields can extend and transform your data by allowing you to apply calculations to create new metrics and dimensions. With calculated fields, you can answer questions that existing dimensions cannot answer. For example, whether you’re outpacing your monthly budget, or the average time on site for groups of custom geographic regions – super handy stuff.

4. Sharable and interactive
It’s highly likely you and your team members will have different requirements for your data. You may want to simply check on how much that new Pinterest campaign is spending this month to date, whereas your colleague may want an in-depth overview of performance over the last quarter compared to the previous year.
This is no problem at all. Looker Studio is easily shareable via a URL that can be opened on any browser, operating system or device. Once email access has been granted, it can also be set up to allow different users to easily flick between the views and date ranges they need to see – either at the entire report level or individual graph/table/chart level.
5. No limitations
If attribution isn’t a consideration, Google Analytics dashboards can provide a useful starting point for data visualisation, but one of the key setbacks is that there are limits on the amount of widgets and properties you can use. So you can only have 12 graph/table/charts per dashboard and no more than 20 dashboards per property.
That may sound like a lot, but in practice this would be 2.5 each for your main source/medium paths, assuming you are only running on three advertising platforms; (all traffic), Google/organic, Bing/organic, direct/none, ‘email provider’/email, Google/cpc, Facebook/cpc, Bing/cpc.
Unlike Google Analytics, Looker Studio has no limitations at all! So if you’ve got a lot of different data points that you need to keep track of, then Looker Studio becomes your best bet.
6. Scheduled exports and embed features
If Looker Studio seems like just one more thing you need to remember to check each day, week, or month, then scheduled exports might help reduce the load.
Looker Studio can send a PDF report automatically on a regular basis via email, to up to 50 recipients, along with a customisable email message and link to the live dashboard. These dashboards can also handily be embedded into websites via iframe, as well as being fully integrated with work management platforms, such as Monday.com, to ensure your data is always close to hand when you need it.
7. And finally… it’s free!
Looker Studio packs in a ton of useful functionality – especially for a free tool! So if you’re drowning in data and unable to see the wood for the trees, we’d highly recommend getting started with some dashboards today.
Need help getting started?
Sometimes starting is the hardest part, and no matter how great the software, it can feel like a bit of a learning curve.
Sound like you? Our team is in Looker Studio nearly every day, so we can get you up and running quickly with dashboards and reports that will help you make strategic marketing decisions.
Submit the form and tell us what you’re after, and we’ll get right back to you!


